Blog
What is On-Chain Analysis? A Beginner’s Guide to Decoding Blockchain Data
Learn how on-chain analysis works, why it matters, and which tools help you turn public blockchain data into useful insights.
Contributors
Analytic Sages
In today’s world, blockchain technology is shaking up industries, from finance to art. You’ve probably heard of Bitcoin, Ethereum, and even NFTs, but have you ever wondered what happens behind the scenes?
How do we track transactions, monitor market trends, and predict the next big shift in the blockchain ecosystem? The answer is on-chain analysis.
Imagine you’re at a busy marketplace. People are exchanging goods. While most transactions happen in the open, you can’t always see who’s buying or selling what. Now picture a smart vendor in the corner with a ledger, noting every sale, every product, and every transaction. That is what blockchain does digitally, transparently, and in a way that is tamper-proof.
That ledger is on-chain data, and on-chain analysis is the method used to track and analyze it.
On-chain analysis is the process of studying the transactions happening on a blockchain. Networks like Bitcoin or Ethereum keep records of every transaction: who sent what, how much was sent, and when. All of this information is stored on the blockchain and is publicly visible to anyone who knows where to look.
The challenge isn’t finding the data. It’s understanding it. On-chain analysis helps you break down and interpret this data so you can make informed decisions.
Think of yourself as a detective with a treasure map (the blockchain). You need to find the hidden treasure: valuable insights. Here’s how on-chain analysis helps:
Tracking transactions: Follow the flow of funds between wallets, whether a large whale or a regular user is moving tokens.
Identifying market sentiment: Activity patterns can reveal how people feel about a token or project. Heavy buying and selling may signal a shift in sentiment or a potential price move.
Measuring network health: Metrics like transaction volume, miner activity, and gas fees help you understand how healthy a blockchain is. Low activity can signal fading interest; high activity often points to growing engagement.
A real-life example is Bitcoin’s price movements. On-chain analysis can help explain sudden spikes by tracking whale wallets. Large sales can precede dips; large buys can suggest a price hike is coming.
Beyond price tracking, on-chain analysis is used to spot trends, analyze project growth, monitor security, and anticipate where blockchain projects may be headed.
Why it matters: it supports better decisions for investors, developers, and curious learners; adds another layer of transparency on top of blockchain itself; and helps with risk management by flagging unusual patterns such as large sales or dormant wallets coming back online.
Common tools for on-chain analysis include Dune Analytics for custom dashboards, Glassnode for crypto metrics, and Nansen for Ethereum address tracking and whale behavior.
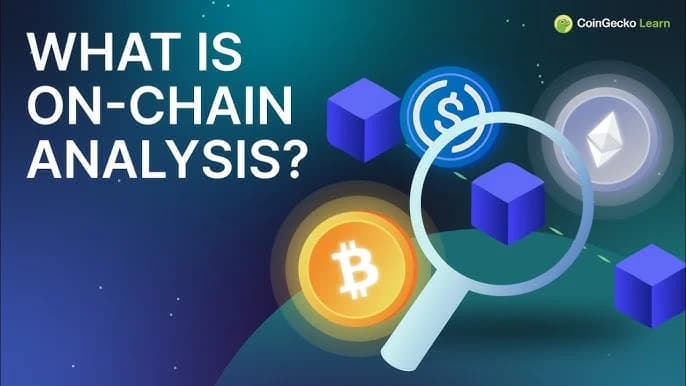
On-chain analysis is like a magnifying glass for the hidden stories inside blockchain data. As blockchain grows, this skill becomes more valuable, whether you’re an investor, developer, or aspiring data analyst.
Want to go deeper? Join Analytic Sages and learn how to use on-chain analytics to make informed, data-driven decisions in the blockchain space.